効果量(Effect size)
効果量(Effect size)とは?
効果の程度を表す指標です。効果量にも様々な効果量がありますが、ここでは、平均値の差の程度を表す効果量を扱います。
効果量を示すことで、どのくらい効果があるかを示すことができます。
ここでは、平均値の差の指標であるCohen’s dとHedges’ gについて扱います。
計算方法
HPによっても記載のブレがありますが、このあと使用するRのライブラリ1の式を以下に載せます。Nishii’s Notebookさんに記載の式とも一致しています2。
# Cohen’s d
# Hedges’ g
例題
RのSleepデータを使用します。
10人の患者に対して、2種類の薬を使用し、対照薬使用時との睡眠時間の差分を算出したデータです。
#!/usr/bin/env Rscript
data(sleep)
sleep
extra group ID
1 0.7 1 1
2 -1.6 1 2
3 -0.2 1 3
4 -1.2 1 4
5 -0.1 1 5
6 3.4 1 6
7 3.7 1 7
8 0.8 1 8
9 0.0 1 9
10 2.0 1 10
11 1.9 2 1
12 0.8 2 2
13 1.1 2 3
14 0.1 2 4
15 -0.1 2 5
16 4.4 2 6
17 5.5 2 7
18 1.6 2 8
19 4.6 2 9
20 3.4 2 10
例題 - 可視化
以下のコードによって可視化します。
#!/usr/bin/env python
# jupyterで実行する場合
# %matplotlib inline
import matplotlib.pylab as plt
group1 = [0.7, -1.6, -0.2, -1.2, -0.1, 3.4, 3.7, 0.8, 0.0, 2.0]
group2 = [1.9, 0.8, 1.1, 0.1, -0.1, 4.4, 5.5, 1.6, 4.6, 3.4]
plt.boxplot([
group1, group2
])
plt.savefig("plt.boxplot.sleep.png")
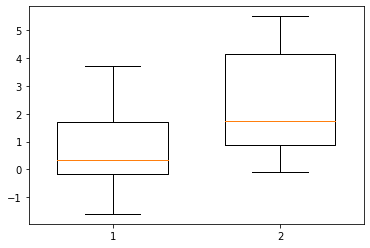
パッと可視化すると、group2の方が睡眠時間の増加が大きいように見えます。
group1とgroup2の間で睡眠時間の増加がどのくらいであるかをCohen’s dおよびHedges’ gについて計算してみます。
ソースコード
Pythonでは信頼区間まで算出してくれるライブラリがないため、Rのライブラリを使用します1。
# Rで効果量の計算
#!/usr/bin/env Rscript
# install.packages("effectsize")
library("effectsize")
group1 = c(0.7, -1.6, -0.2, -1.2, -0.1, 3.4, 3.7, 0.8, 0.0, 2.0)
group2 = c(1.9, 0.8, 1.1, 0.1, -0.1, 4.4, 5.5, 1.6, 4.6, 3.4)
d = cohens_d(group1, group2)$Cohens_d
d_low95 = cohens_d(group1, group2)$CI_low
d_high95 = cohens_d(group1, group2)$CI_high
g = hedges_g(group1, group2)$Hedges_g
g_low95 = hedges_g(group1, group2)$CI_low
g_high95 = hedges_g(group1, group2)$CI_high
print(d) # => -0.8321811
print(d_low95) # => -1.738817
print(d_high95) # => 0.09545044
print(g) # => -0.7970185
print(g_low95) # => -1.665346
print(g_high95) # => 0.09141732
その他
# 効果量の95%信頼区間の算出方法
RのeffectsizeライブラリとNakagawa and Cuthillらの標準誤差を使用した方法では95%信頼区間は若干ずれがあります。effectsizeライブラリでは、以下のように求めたと記載しています。
Unless stated otherwise, confidence intervals are estimated using the Noncentrality parameter method; These methods searches for a the best non-central parameters (ncps) of the noncentral t-, F- or Chisquared distribution for the desired tail-probabilities, and then convert these ncps to the corresponding effect sizes.
ソースコードレベルまで追うと、以下のように求めているようです。
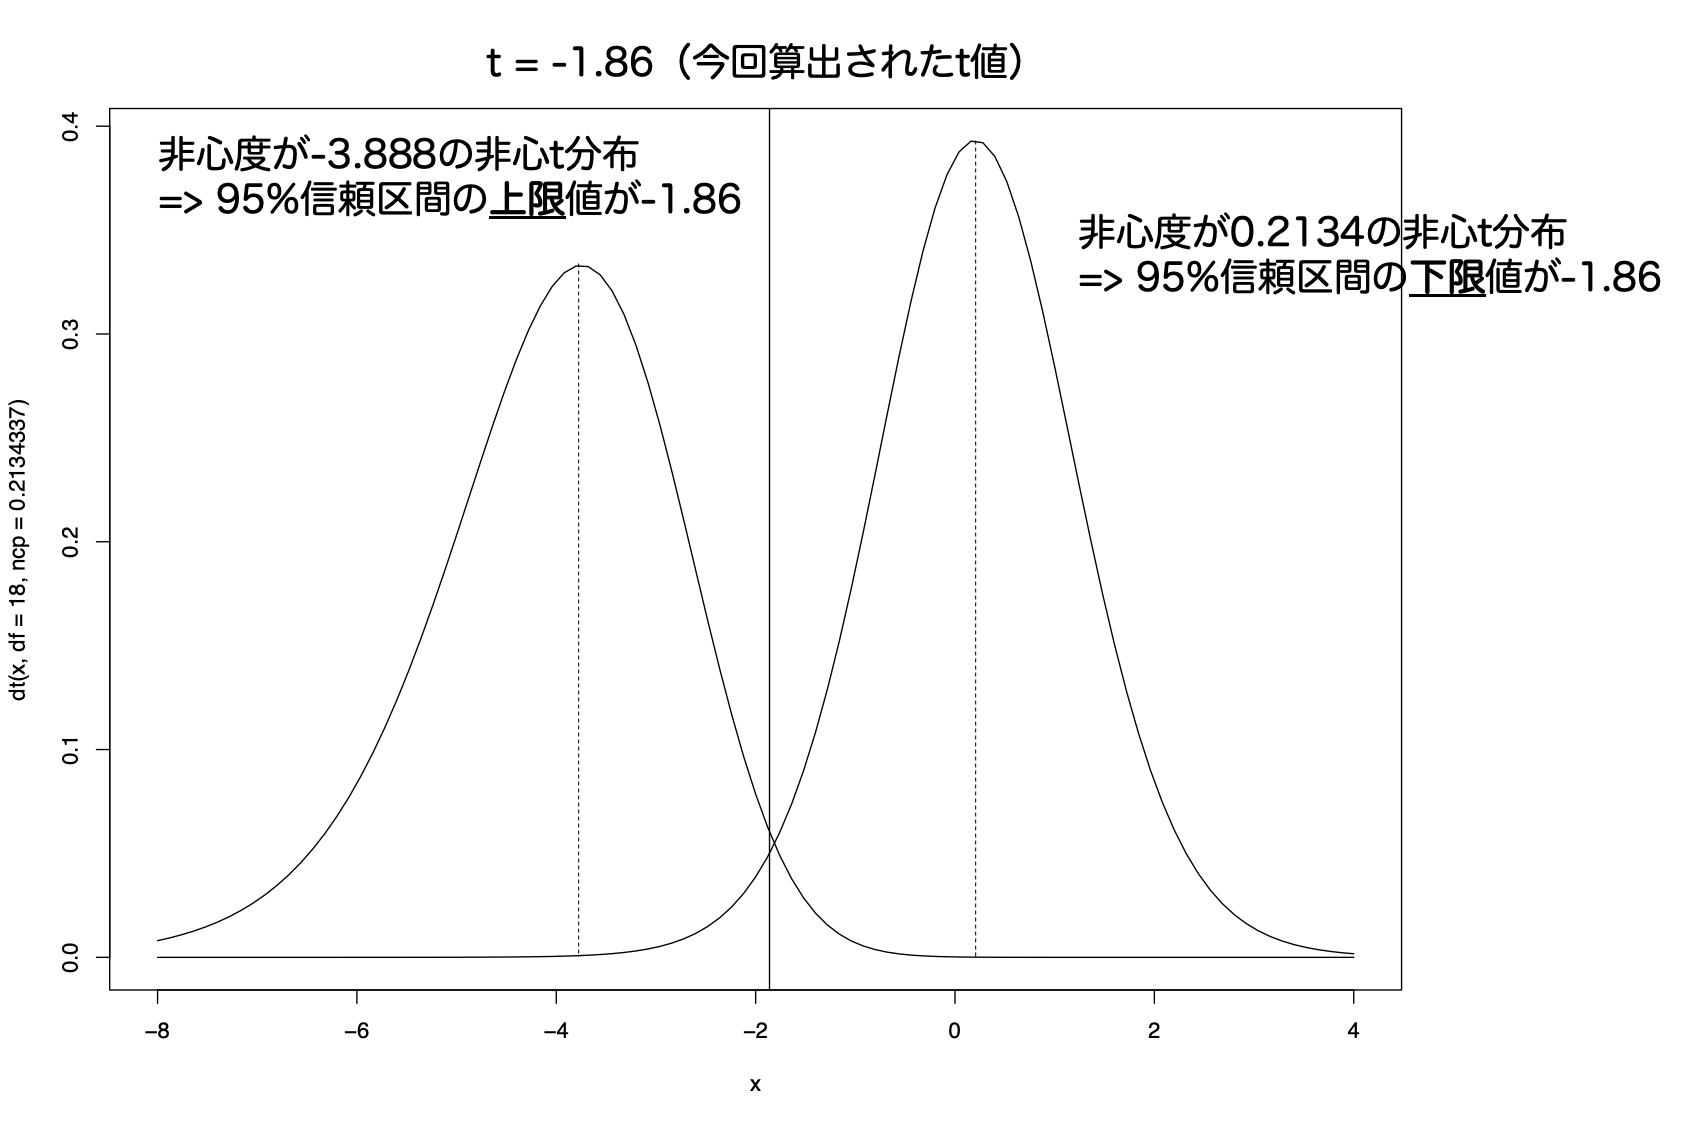
①:群間を比較した際の統計値である、t値を求める
②:このt値は、有意差があるときは非心t分布(最頻値=非心度が0からずれたt分布)にしたがうことが知られている
③:95%信頼区間の上限値が今回求めたt値となるような非心度の非心t分布を探索する
=> この値が効果量の下限値となり、逆側も探索することで上限値が求まる
イメージとしては以下のような感じ
実際は以下のようなソースコードで求めています。
#!/usr/bin/env Rscript
get_ncp_t <- function(t, df_error, conf.level = 0.95) {
alpha <- 1 - conf.level
probs <- c(alpha / 2, 1 - alpha / 2)
ncp <- suppressWarnings(optim(
par = 1.1 * rep(t, 2),
fn = function(x) {
p <- pt(q=t, df=df_error, ncp=x)
abs(max(p) - probs[2]) + abs(min(p) - probs[1])
},
control = list(abstol = 1e-09)
))
t_ncp <- unname(sort(ncp$par))
return(t_ncp)
}
group1 = c(0.7, -1.6, -0.2, -1.2, -0.1, 3.4, 3.7, 0.8, 0.0, 2.0)
group2 = c(1.9, 0.8, 1.1, 0.1, -0.1, 4.4, 5.5, 1.6, 4.6, 3.4)
n1 = length(group1)
n2 = length(group2)
hn <- (1 / n1 + 1 / n2)
# 非心t分布の自由度
df = n1 + n2 - 2
# t検定における統計値(t値)を求める
t_test_result = t.test(group1, group2)
t = t_test_result$statistic
# 非心度を探索
t_lowhigh <- get_ncp_t(t, df, 0.95)
ci_low <- t_lowhigh[1] * sqrt(hn)
ci_high <- t_lowhigh[2] * sqrt(hn)
print(ci_low) # => -1.738817
print(ci_high) # => 0.09545044
なお、上記の分布は以下のソースコードにて描画しています。
#!/usr/bin/env Rscript
curve(dt(x, df=18, ncp=0.2134337), -8, 4)
curve(dt(x, df=18, ncp=-3.8881125), -8, 4, add=T)
abline(v=t)
print(qt(0.025, df=18, ncp=0.2134337)) # => -1.860813
print(qt(0.975, df=18, ncp=-3.8881125)) # => -1.860813
引用文献
-
Lüdecke D, Waggoner P, Makowski D. insight: A Unified Interface to Access Information from Model Objects in R. J Open Source Softw [Internet]. 2019 Jun 25;4(38):1412. Available from: http://joss.theoj.org/papers/10.21105/joss.01412 ↩ ↩2
-
Nakagawa S, Cuthill IC. Effect size, confidence interval and statistical significance: a practical guide for biologists. Biol Rev Camb Philos Soc [Internet]. 2007 Nov;82(4):591–605. Available from: http://www.ncbi.nlm.nih.gov/pubmed/17944619 ↩